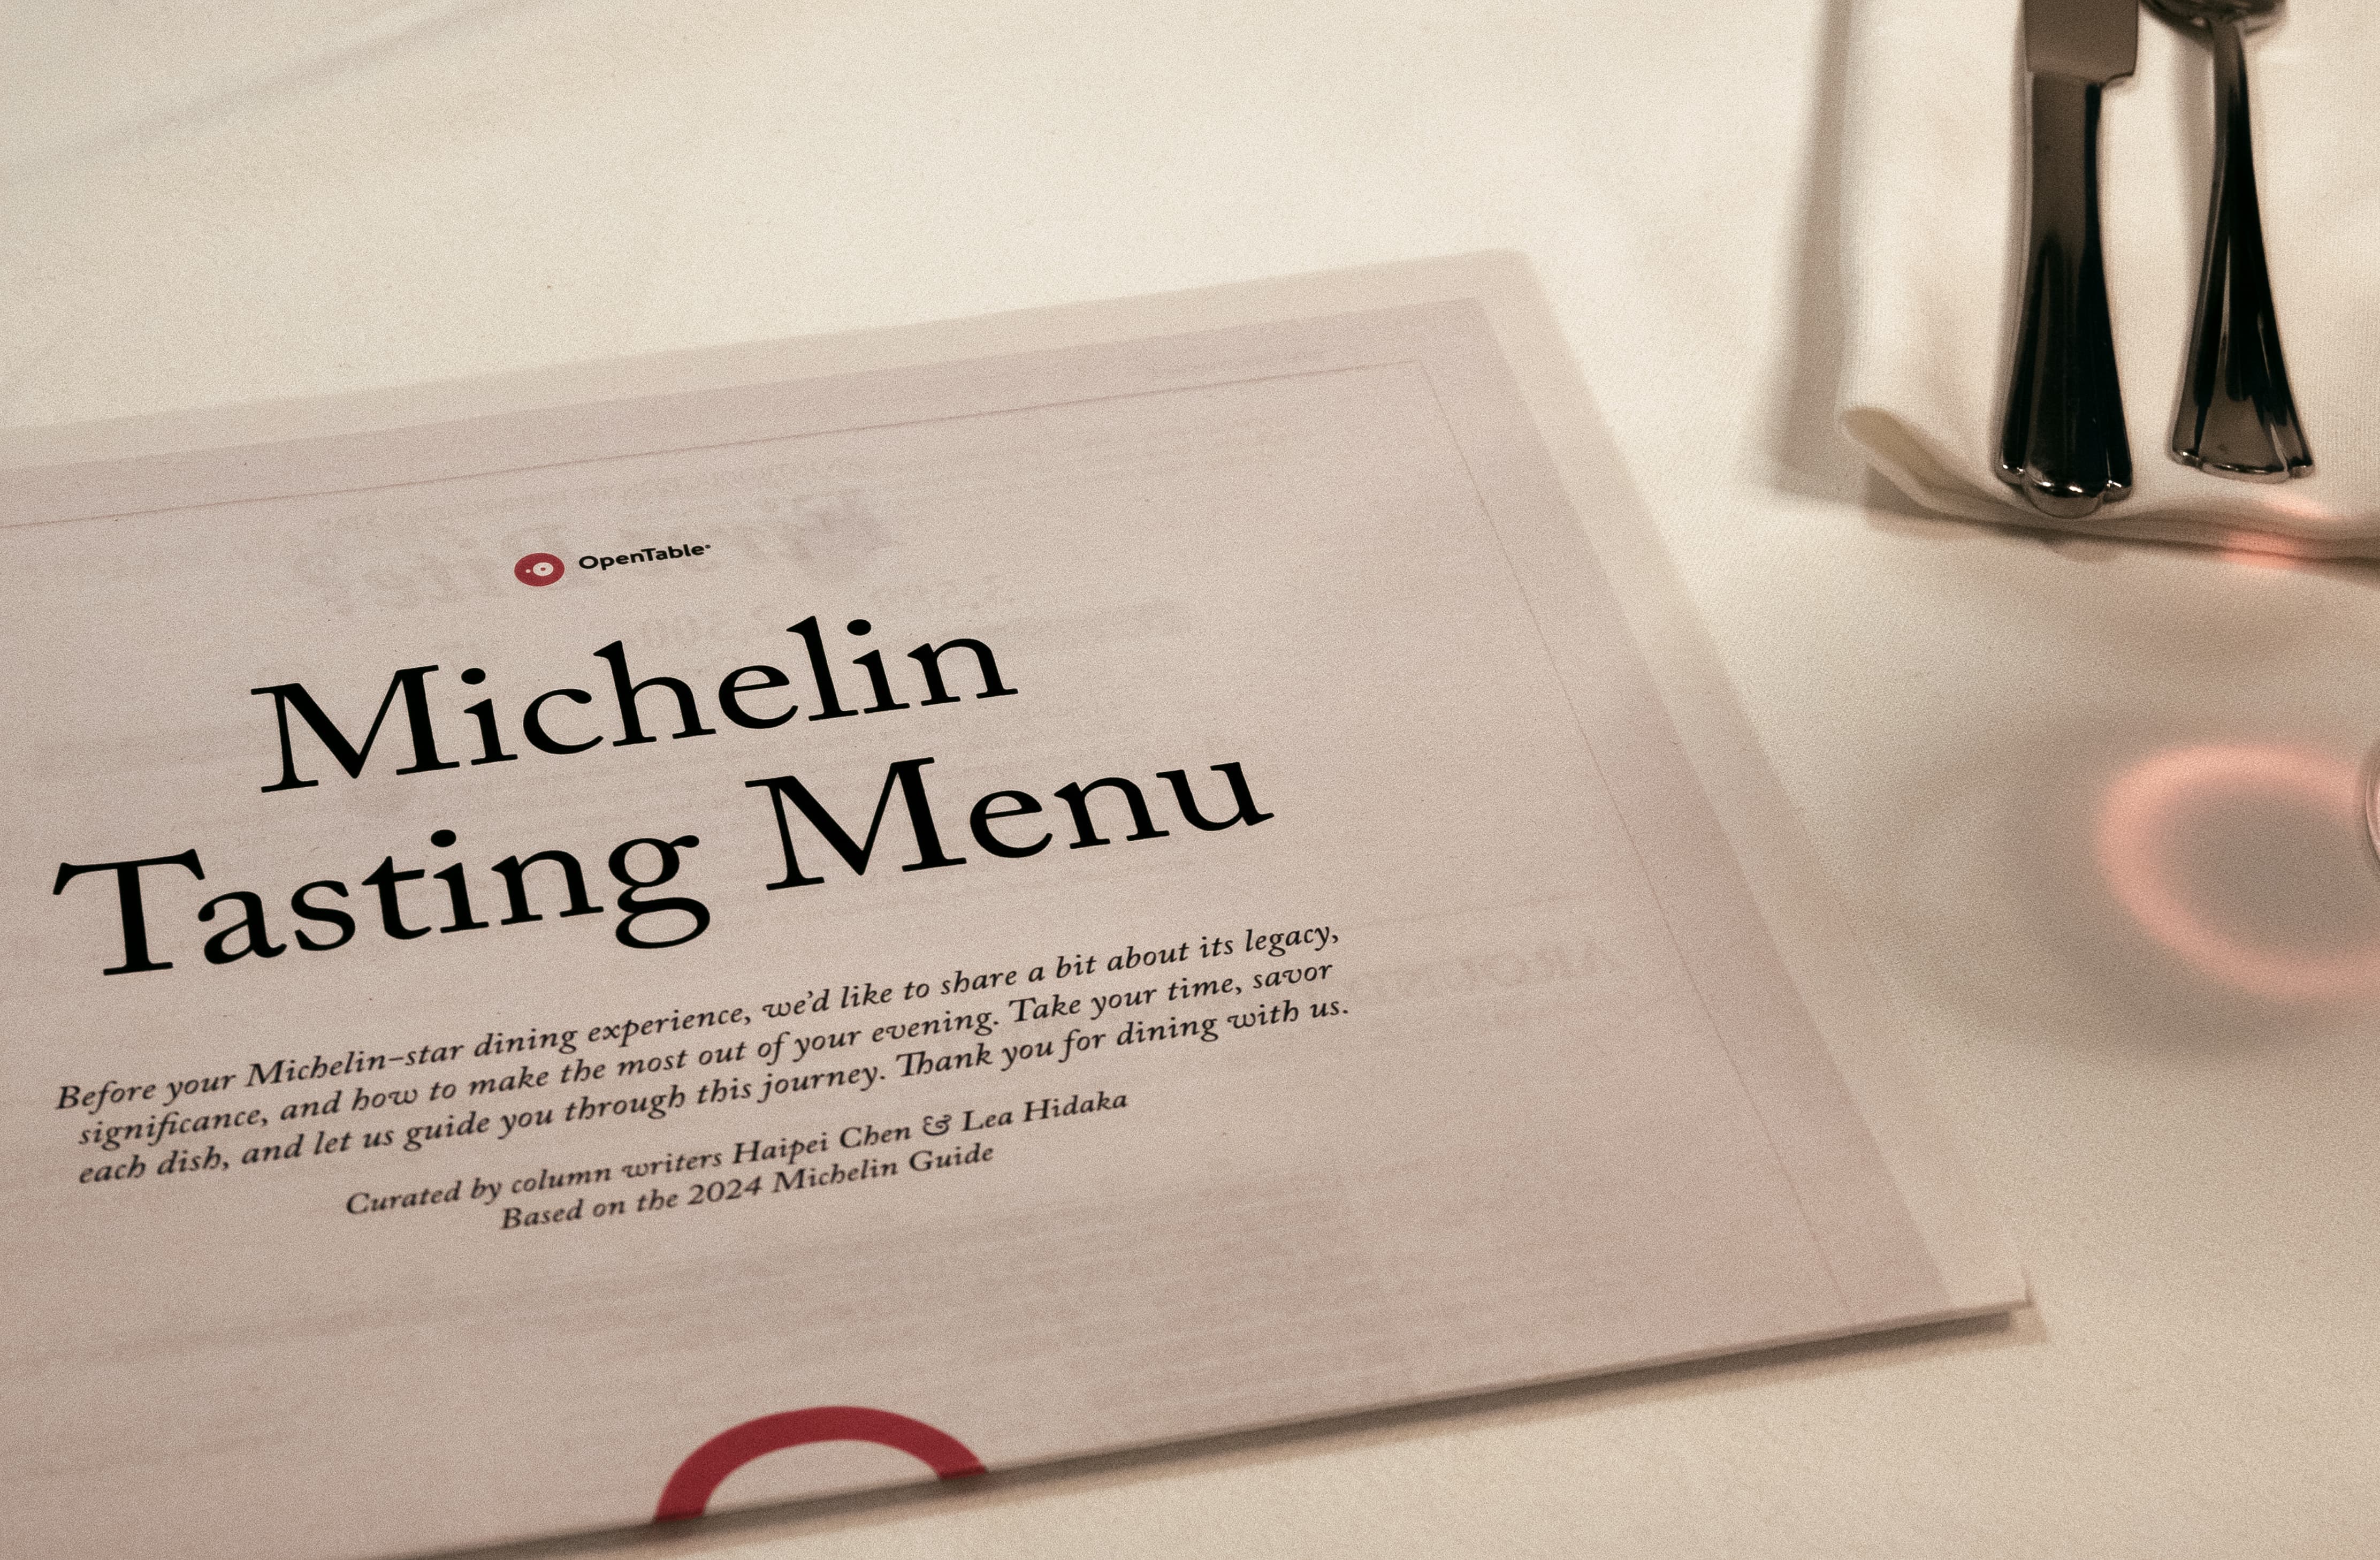
Michelin Tasting Menu
DATA VISUALIZATION, PUBLICATION DESIGN, WEB DESIGN
TIMELINE: 10 WEEKS
TEAM: HAIPEI CHEN
While the Michelin Star is widely known, few truly understand the rigorous standards behind earning the award. This project features an 8-page printed broadsheet and an interactive scrollytelling website, working together to create a comprehensive exploration of Michelin Star restaurants based on the 2024 Michelin Guide.
As part of OpenTable’s quarterly fine dining publication, the issue Michelin Tasting Menu is a data visualization broadsheet + scrollytelling website demystifying the prestigious world of Michelin Stars.


Taking visual cues from cookbooks and paper menus, the broadsheet evokes an informative yet approachable tone to the viewership. The broadsheet features a series of visualizations on the Michelin Star Restaurants, showcasing the global distribution, price points and reviews, and an in-depth case study on the behind the scenes of a restaurant. This broadsheet gives a general, yet comprehensive overview, on Michelin Star restaurants, encouraging the readers to form their own judgment on whether it’s worth the cost.
A GUIDE TO THE MICHELIN GUIDE


WEB NARRATIVE: BTS AT A MICHELIN RESTAURANT
The scrollytelling website dives deeper into the case study of Michelin-Starred New York restaurant, Crown Shy, uncovering the amount of effort required to earn and maintain even a single star. The website breaks down key aspects of the restaurant highlighting the workers, signature dishes, and reviews, creating a well-rounded look into the Michelin experience from both the perspectives of the staff and the customers. At the end of the website, a call to action also brings viewers to look back to the broad sheet. This immersive storytelling ties back to the broadsheet’s data, giving audiences a closer look and a richer perspective.

FINAL THOUGHTS
Creating The Michelin Tasting Menu was truly an insightful journey from start to finish. From the research phase to execution, I learned how crucial it is to consider the audience when shaping our narrative and business strategy. Lastly, Data can often feel overwhelming, especially after it’s been collected. I found myself asking, "Now what?" and "What can our audience gain from this?". However, throughout process, I realized the power of presenting information clearly and in an engaging way, ensuring our data not only informs but also resonates with the audience.
